“Unemployment is a situation in which individuals are ready & willing to work at the prevailing rate of wages but are not able to get work.”
NSSO defines unemployment as a situation in which all those, owing to lack of work, are not working but either seek work & express their willingness or availability for work under the prevailing condition of work and remuneration.
Labour Force
It consists of the people aged 15 and up to 59 years (working age population), who are employed and unemployed (people who don’t have jobs but are looking for work) and those who are in this age group but not looking for work (like students, housewives or even people who do not want to work).
People below 15 years and above 59 years are dependents and are not part of labour force or working age population, they are referred as dependent age group.
Ageing
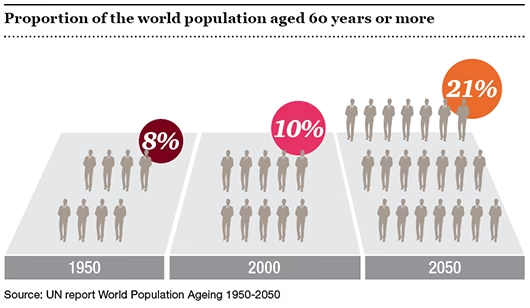
Population aging is a demographic shift that occurs when fertility rates decline and life expectancy increases, resulting in an older population as a large share of the total population. This is an inevitable outcome of the demographic transition, which is the shift from higher to lower fertility and mortality rates.

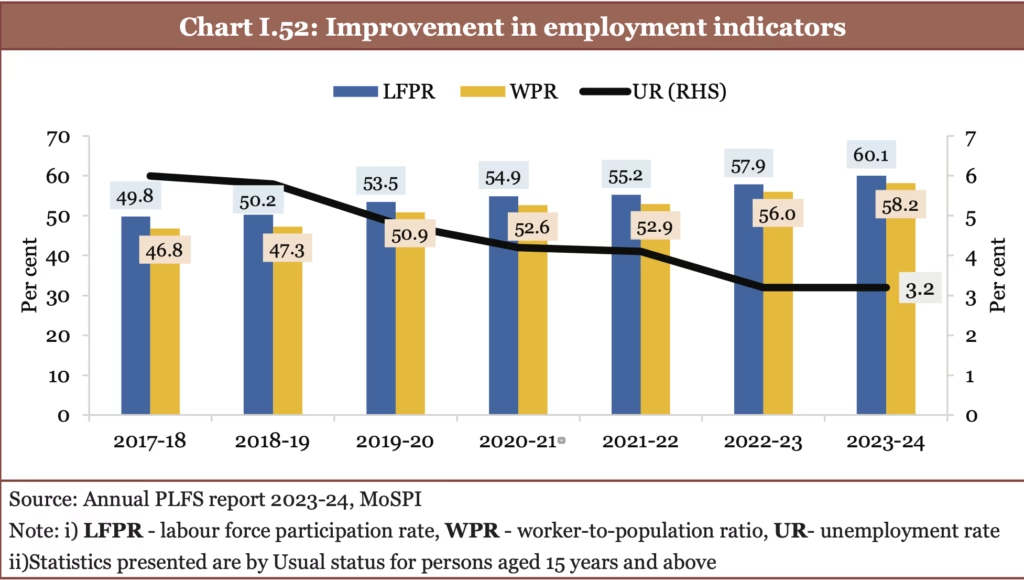
The Labour force participation rate (LFPR)
Labour force participation rate is calculated by dividing number of employed and unemployed people by total number of people in labour force.
LFPR = (Number of employed people + Number of unemployed people) / Total working age population (labour force).
Work Force: That part of the labour force which is employed.
Worker to population Ratio(WPR)
Worker Population Ratio (WPR) is the percentage of persons employed among the persons in the population.
The employment-to-population ratio is equal to the number of persons employed divided by the working-age population and multiplied by 100. It is used as a metric of labor and unemployment.
The Periodic Labour Force Survey (PLFS) gives estimates of Key employment and unemployment Indicators like the Worker Population Ratio (WPR).

Employment elasticity
Percentage change in employment induced by changes in G.D.P. Hence, elasticity of employment seeks to capture the responsiveness of the labour market to changes in macroeconomic conditions as represented by G.D.P growth.
Jobless Growth
Jobless growth refers to a situation where an economy experiences robust growth in terms of GDP without a corresponding increase in employment opportunities.
In India’s case, the phenomenon has become particularly pronounced since the 1990s, following the liberalisation, privatisation, and globalisation (LPG) reforms.
Employment Rate
Ratio of number employed people to (number of employed people + number of unemployed people).
Unemployment Rate
Ratio of the number of unemployed people to that of the number of employed people and number of unemployed people.
Types of Unemployment
Cyclical Unemployment
It comes around due to the business cycle itself. It increases during periods of recession/slowdown and falls during periods of economic growth.
Frictional Unemployment
This kind of unemployment occurs when a person leaves/loses a job and starts looking for another one. This search for a job may take a considerable amount of time resulting in frictional unemployment.
Seasonal Unemployment
This kind of unemployment is expected to occur at certain parts of the year. For example, the people at hill stations may experience seasonal unemployment during the winter months because less people will visit these areas during this time. Another case could be the seasonal unemployment in agriculture.
Structural Unemployment
This kind of unemployment happens when the structure of an economy changes. It essentially occurs because there exists a mismatch of skills between the skills of the unemployed and skills needed for the job.
E.g., when computers came, the people who worked on typewriters became unemployed.
Underemployment
This term can be used in multiple connotations but one of the major usages is to showcase a situation where a person with high skills works in a low wage and low skills job.eg a Post graduate scholar working as a peon.
Disguised Unemployment
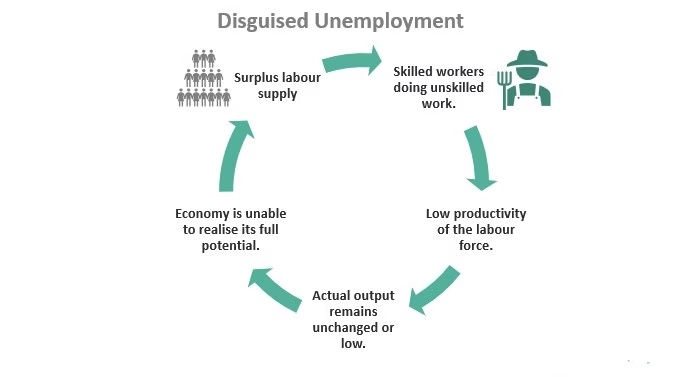
It occurs when people are employed in a job where their presence or absence does not make any difference to the output of the economy. It is a special kind of case. Here people are apparently employed but their marginal product is zero (contribution to production is nil). Marginal product here refers to the produce added to the existing production due to addition of a new employee/ worker.
E.g., if 4 persons are employed in a factory and they produce 17 units and a fifth person is added and the production increases to 19 units, the additional 2 units is marginal product. Here, we can consider the fifth person as employed. If there is no increase in production, the marginal product is zero and he is disguisedly unemployed. Even if he is removed from the activity, there will be no decline in production.
Such type of unemployment is quite common in the agricultural sector in India. Because of the large families in the rural areas several people work on farms and at times, the work of 2-3 people is done by 4-5 people because otherwise it would result in unemployment. But in reality, this is nothing but a case of disguised unemployment.

Q1. Disguised unemployment generally means (UPSC Prelims 2013)
(a) large number of people remain unemployed
(b) alternative employment is not available
(c) marginal productivity of labour is zero
(d) productivity of workers is low
Q1. Disguised unemployment generally means
(a) large number of people remain unemployed
(b) alternative employment is not available
(c) marginal productivity of labour is zero
(d) productivity of workers is low
Voluntary Unemployment
One is classified as voluntary unemployed, if he or she is not employed and is not willing to join the workforce. It is mostly because people choose not to work below a certain income level after ‘investing’ in education. There has been a dramatic rise of voluntary unemployment across the country.
Open unemployment
This refers to a situation when there are some workers who have absolutely no work to do. They are willing to work at the prevailing wage rate, but they are forced to remain unemployed in the absence of work. These workers are completely idle. Such unemployment is clearly visible as the number of such persons can be clearly counted and therefore it is known as open unemployment.
Causes of Unemployment in India
Defective education system
Failing education system that creates thousands of unemployable graduates. Aspiring minds latest National Employability Report reveals that there is no massive progress on the employability on Indian engineers as over 80 percent continue to be unemployable (lack skills to get employment. The skills which they possess are different from what is demanded or required by the industry).
Slow economic growth
It leads to inadequate job creation (the non-farm sector eg. Manufacturing sector needs to be encouraged as land is limited and can create only limited jobs and also agriculture is seasonal).
Other factors include:
Lack of infrastructural development
Rapid population growth
Inadequate employment
Wrong growth strategy
If we see employment growth between 1989 and 2010, informal firms account for most employment growth and nearly all the increase in the number of establishments since 1989. Of the 10.5 million new manufacturing jobs created between 1989 and 2010, only 3.7 million – 35 percent were in the formal sector.
This pattern is even starker when looking at growth in establishment counts: total establishment increased by 4.2 million from 1989 – 2013, but the formal sector accounted for 1.2 percent of this growth.
However, trends seem somewhat different after 2000: Informal sector establishment counts flatten as employment actually falls, while formal sector employment picks up. This might be related to the increasing use of contract labour.
Sixty years of planned development have been aimed at expansion of the economy through increase in national output and employment. During the period 1950–2010, Gross Domestic Product (GDP) of India grew positively and was higher than the employment growth. However, there was always fluctuation in the growth of GDP. During this period, employment grew at the rate of not more than 2 per cent.
In the late 1990s, employment growth started declining and the gap between the growth of GDP and employment further widened. This means that the Indian economy, without generating employment, was able to produce more goods and services. This phenomenon is known as jobless growth.
Approx 51 % of India workers are self-employed with 54% in the rural areas and 41% in urban areas. The majority of the so called self-employed are in this category of self-employed not by choice but due to lack of employment opportunities. Infact a large number of poor belong to this category, who engage themselves in petty, part time occupations because industries and services are not able to absorb them & substantial numbers of rural self-employed people also resort to casual labor work in order to supplement their income.
Also, female employees both in rural and urban areas, receive less remuneration than their male counterparts doing similar jobs. There has been an increase in the number of casual laborer. They now constitute 30% of the workforce in the country.
93% of India’s total workforce is in the unorganized sector and this situation hasn’t changed over the last two decades. Unorganized workforce is denied the benefit of minimum wages, health care, due leaves and other benefits.
Thus, the overall employment scenario in a country is mixed after two decades of launching of the liberalization process.
Jobless Growth in India
It is an economic phenomenon in which a macroeconomic experiences growth while maintaining or decreasing its level of employment. India faced jobless growth from period 2004 -2005 to 2009-10. The robust growth witnessed by India, has been mostly associated with a rapid rise in labour productivity, rather than an expansion in employment. The total employment grew only by 0.1 per cent during 5 years till 2009-10 (from 457.9 million in 2004-05 to 458.4 million in 2009-10), while labour productivity grew by more than 34 per cent in total during this period.
Rather India has been facing jobless growth since economic reforms were brought in early 1990s. The mains reasons for this is,
1. GDP growth arising out of services sector and not from the labour-intensive agriculture and manufacturing sector.
2. Even the growth in the manufacturing sector is coming from the capital intensive sectors such as steel and automobile and not from the labour intensive sectors.
3. In services sector also, the growth is because of increase in efficiency and not because of increase in employment.
4. Major reason for GDP growth is increase in profits of the firms and there has not been a proportionate increase in the salaries of the employees.
5. The skills possessed by Indian youth is different from the skills required by the industry. Rather most of Indian youth is unskilled and those who are skilled, they are acquiring their skills from the it is whose curriculum is outdated and the trainers are also not updated with the skills currently required.
Because of these reasons Indian youth remains unemployable. In these circumstances, Indian corporate prefer capital intensive production even though India is labour surplus.
6. Archaic labour laws hinder investment in the manufacturing sector. These labour laws are 50-70 years old and were enacted to protect the interests of labourers.eg.
Under Industrial Disputes Act, 1947, a firm which employs more than 100 regular workers, can’t fire a single employee without government permission.
This permission generally doesn’t come because it will show the government in bad light (a government which encourages unemployment).
Hence firms keep the number of regular employees below 100 and for the other purposes, hires contractual workers. Moreover, it discourages FDI in manufacturing sector, as FDI would like to hire a large number of workers, but the above act, creates hurdles in the above. Hence FDI doesn’t come to India which results in less opportunities in job creation.
Measuring Unemployment in India
Periodic Labour Force Survey
It was launched in April 2017 by the Ministry of Statistics & Programme Implementation.
It was launched as a new regular employment-unemployment survey with certain changes in survey methodology, data collection mechanism and sampling design vis-à-vis the earlier quinquennial (once in every five years) Employment and Unemployment surveys of NSSO.
Now, NSO conducts PLFS annually, while for urban areas it is done quarterly also. It has been launched with an objective of measuring quarterly changes of various labour market statistical indicators in urban areas as well as generating annual estimates of these indicators both for rural and urban areas, which can be used for policy making. It would supply data not only about the formal sector, but also about the informal sector.
The PLFS is designed to generate the indicators of labour market operations using two approaches
Usual Status (US) approach
This approach records only those persons as unemployed who had no gainful work for a major time during the 365 days preceding the date of survey and are seeking or are available for work. Thus, the estimates of unemployment obtained on the basis of usual status approach are expected to capture long-term open unemployment.
Current Weekly Status (CWS) approach
Problems in measuring Unemployment in India
Measuring unemployment in India is fraught with challenges due to the informal nature of jobs, short-term employment patterns, and socio-economic factors. These complexities often hinder the accurate representation of the labour market. The key challenges in measuring unemployment in India are as follows:
- Informal Nature of Jobs: A large informal sector complicates consistent employment classification as individuals often work intermittently across various activities.
- Short-Term Employment: Workers may alternate between casual labour, seasonal jobs, and unemployment within a year, making accurate categorization challenging.
- Exclusion of Willing Workers: Social norms, especially for women, prevent many from actively seeking work.
- For example, several rural women reported willingness to work if jobs were available at home, yet they remain excluded from the labour force.
- Economic Disruptions: Events like the 2020 lockdown led to temporary job losses not fully captured by PLFS due to aggregation over time.
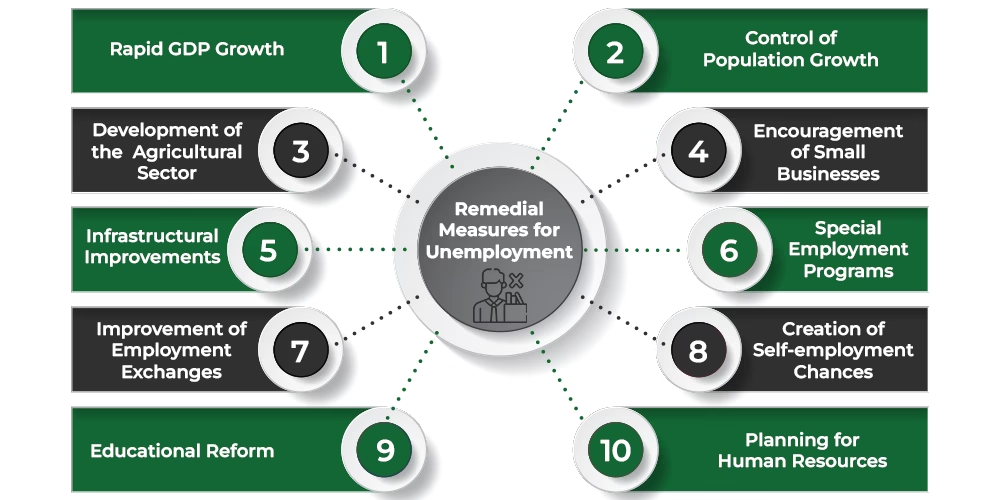
How to reduce unemployment in India?

Mains Previous Year Questions
Q1: Most of the unemployment in India is structural in nature. Examine the methodology adopted to compute unemployment in the country and suggest improvements.(2023)
Q2: How globalization has led to the reduction of employment in the formal sector of the Indian economy? Is increased informalization detrimental to the development of the country?(2016)
Q3: Comment on the challenges for inclusive growth which include careless and useless manpower in the Indian context. Suggest measures to be taken for facing these challenges.(2016)
Q4: The nature of economic growth in India in recent times is often described as jobless growth. Do you agree with this view? Give arguments in favour of your answer.(2015)
Q5: While we found India’s demographic dividend, we ignore the dropping rates of employability. What are we missing while doing so? Where will the jobs that India desperately needs come from? Explain.(2014)
Mains Practice Questions
Q1: Rural wage stagnation has emerged as a significant issue in India’s economic landscape, with implications for poverty alleviation and rural development. Analyse the factors contributing to stagnant rural wages and their socio-economic impact.
The Indian economy grew at an average annual rate of 4.6% between 2019-20 and 2023-24, and 7.8% in the prior three fiscal years (April-March). For both periods, the farm sector has grown at an average rate of 4.2% and 3.6%. However, these macroeconomic growth rates are not reflected in rural wages.
Wage growth has been estimated in both nominal (current value) and real terms (after deducting annual inflation based on the rural India consumer price index), for all rural and agricultural jobs. The latter comprises processes such as ploughing/tilling, sowing, harvesting/threshing/winnowing, commercial crop picking, horticulture, animal husbandry, watering/irrigation, and plant protection.
The Labour Bureau compiles daily wage rate data for 25 agricultural and non-agricultural occupations, collected every month from 600 sample villages spread over 20 states.
Factors contributing to stagnant rural wages and their socio-economic impact
(i) Rising Labour Force Participation Rates (LFPR) among women, especially in rural India
LFPR is the percentage of the population aged 15 and up who is working or seeking/willing to work for a significant portion of a given year. In 2018-19, the average female LFPR across India was 24.5%. It increased to 30% in 2019-20, 32.5% in 2020-21, 32.8% in 2021-22, 37% in 2022-23, and 41.7% in the most recent official Periodic Labour Force Survey for 2023-24 (July–June).
The rural female LFPR increased from 26.4% in 2018-19 to 33%, 36.5%, 36.6%, 41.5%, and 47.6% during the next five years. During this time (2018-19 to 2023-24), the male LFPR increased only modestly, from 75.5% to 78.8% for all India and 76.4% to 80.2% for rural India.
(ii) Less labour-intensive growth
While the rural female LFPR increased between 2018-19 and 2023-24, so did agriculture’s share of this workforce’s employment, rising from 71.1% to 76.9% over this time. As a result, while more women are entering the rural labour force, they are primarily employed on farms. The movement is from home to field, not factory to office.
If growth comes from sectors or businesses that require fewer workers per unit of output, it results in a greater share of revenue accruing to capital (i.e. firm profits) as opposed to labour (employee wages/compensation).
(iii) Mitigating factor
Capital-intensive, investment-led growth benefits cement, steel, and infrastructure companies including L&T, Adani Ports, KEC International, Bharat Forge, Finolex Cables, Kalpataru Projects, PNC Infratech, and NCC Ltd. However, it is not particularly beneficial to manufacturers of fast-moving consumer products, household appliances, durables, and two-wheelers. They profit more from growth that is labour-intensive and consumer-driven.
The average nominal year-on-year growth in rural earnings throughout the five years ending 2023-24 was 5.2%. It was greater, at 5.8%, for agricultural salaries alone. However, in actual inflation-adjusted terms, rural earnings grew by an average of -0.4% each year, whereas agricultural wages grew by 0.2%.
— According to the Finance Ministry’s Economic Survey for 2023-24, the sharp increase in rural female LFPR (21.2 percentage points since 2018-19) was mostly due to government schemes such as Ujjwala, Har Ghar Jal, Saubhagya, and Swachh Bharat.

