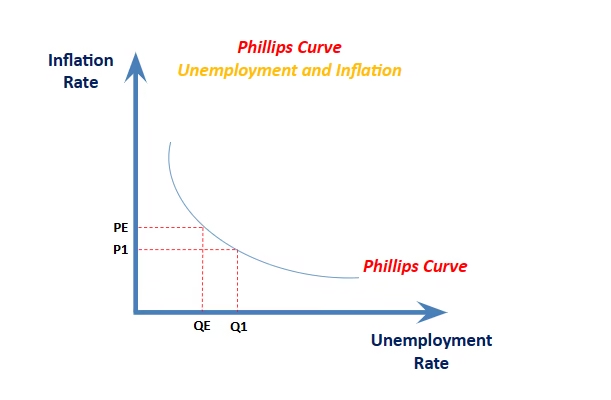
Phillips Curve states that inflation and unemployment have an inverse relationship; higher inflation is associated with lower unemployment and vice versa.
According to him, inflation and unemployment have a stable and inverse relationship.
Developed by William Phillips, it claims that with economic growth comes inflation, which in turn should lead to more jobs and less unemployment.

The concept behind the Phillips curve states the change in unemployment within an economy has a predictable effect on price inflation.
The inverse relationship between unemployment and inflation is depicted as a downward sloping, convex curve, with inflation on the Y-axis and unemployment on the X-axis.
Increasing inflation decreases unemployment, and vice versa. Alternatively, a focus on decreasing unemployment also increases inflation, and vice versa.
The belief in the 1960s was that any fiscal stimulus would increase aggregate demand and initiate the following effects: Labor demand increases, the pool of unemployed workers subsequently decreases, and companies increase wages to compete and attract a smaller talent pool. The corporate cost of wages then increases and companies pass along those costs to consumers in the form of price increases.
This belief system caused many governments to adopt a “stop-go” strategy where a target rate of inflation was established, and fiscal and monetary policies were used to expand or contract the economy to achieve the target rate.
However, the stable trade-off between inflation and unemployment broke down in the 1970s with the rise of stagflation, calling into question the validity of the Phillips curve.
The Phillips Curve and Stagflation
Stagflation occurs when an economy experiences stagnant economic growth, high unemployment, and high price inflation. This scenario, of course, directly contradicts the theory behind the Phillips curve.
