- The Global Multidimensional Poverty Index (MPI) was developed in 2010 by the Oxford Poverty & Human Development Initiative (OPHI) and the United Nations Development Programme and uses different factors to determine poverty beyond income-based lists.
- The MPI, developed by Sabina Alkire and James Foster and adopted by the United Nations Development Programme (UNDP) in 2010, measures deprivation across health, education, and standard of living, and not monetary poverty.
- It replaced the previous Human Poverty Index. The global MPI is released annually by OPHI.
- The global Multidimensional Poverty Index (MPI) is an international measure of acute poverty covering over 100 developing countries. It complements traditional income-based poverty measures by capturing the severe deprivations that each person faces at the same time with respect to education, health and living standards.
- The MPI assesses poverty at the individual level. If someone is deprived in a third or more of ten (weighted) indicators, the global index identifies them as ‘MPI poor’, and the extent – or intensity – of their poverty is measured by the number of deprivations they are experiencing.
- If the household deprivation score is 33.3 percent or greater, the household (and everyone in it) is classed as multi-dimensionally poor. Households with a deprivation score greater than or equal to 20 percent but less than 33.3 percent are near multidimensional poverty.
- The MPI can be used to create a comprehensive picture of people living in poverty, and permits comparisons both across countries, regions and the world and within countries by ethnic group, urban/rural location, as each dimension and each indicator within a dimension is equally weighted.
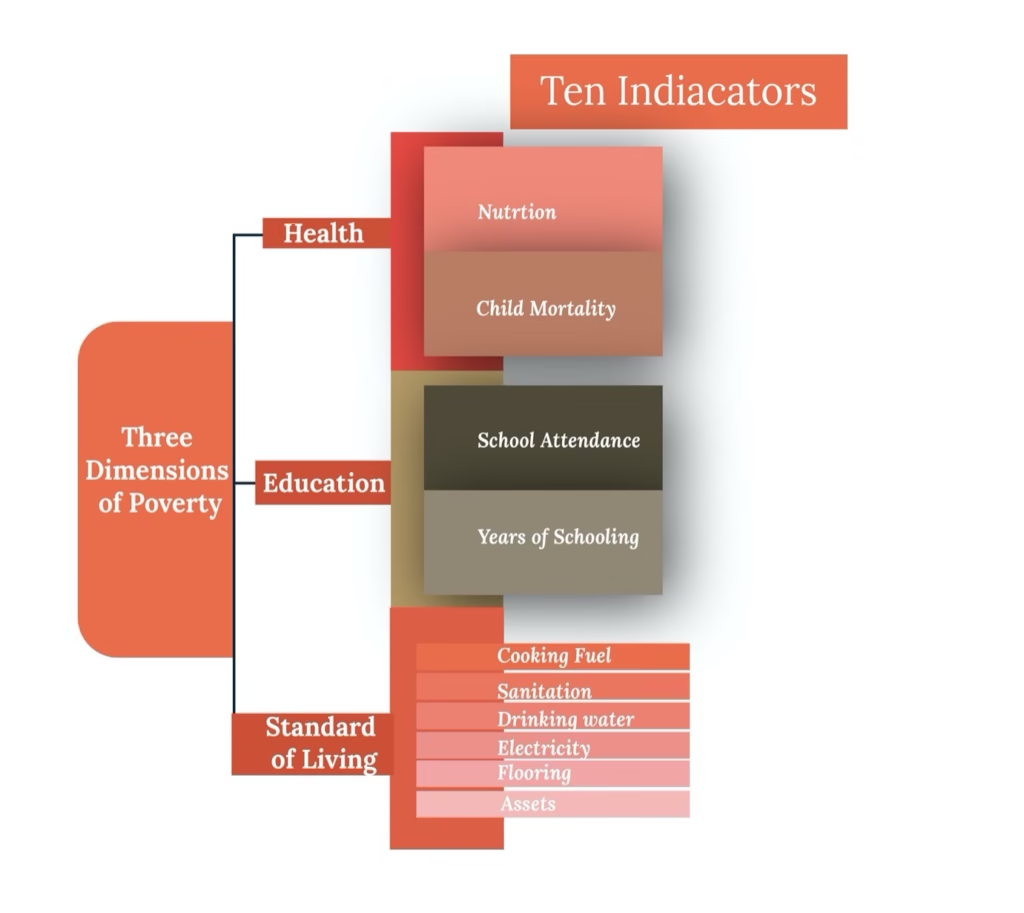
The components of MPI are

Education (each indicator is weighted equally at 1/6)
Years of Schooling: deprived if no household member has completed five years of schooling
Child Enrolment: deprived if any school-aged child is not attending school in years 1 to 8
Health (each indicator is weighted equally at 1/6)
Child Mortality: deprived if any child has died in the family
Nutrition: deprived if any adult or child for whom there is nutritional information is malnourished
Education (each indicator is weighted equally at 1/6)
Electricity: deprived if the household has no electricity
Drinking water: deprived if the household does not have access to clean drinking water or clean water is more than 30 minute’s walk from home
Sanitation: deprived if they do not have an improved toilet or if their toilet is shared
Flooring: deprived if the household has dirt, sand or dung floor
Cooking Fuel: deprived if they cook with wood, charcoal or dung
Assets: deprived if the household does not own more than one of: radio, TV, telephone, bike, or motorbike, and do not own a car or tractor.
The above characteristics make the MPI useful as an analytical tool to identify the most vulnerable people – the poorest among the poor, revealing poverty patterns within countries and over time, enabling policy makers to target resources and design policies more effectively.
National Institution for Transforming India (NITI Aayog), the apex public policy think-tank of the Indian government, in collaboration with the UNDP and Oxford Poverty and Human Development Initiative (OPHI), developed a National Multidimensional Poverty Index to monitor multidimensional poverty at national, state, and district levels in the country.
Multidimensional Poverty in India
In January this year, NITI Aayog released a discussion paper titled Multidimensional Poverty in India since 2005-06 which claims that the country has seen a significant decline in multidimensional poverty from 29.17 per cent in 2013-14 to 11.28 per cent in 2022-23; and 24.82 crore people have “escaped” multidimensional poverty.
The discussion paper sends a positive message that India is on its way to achieve Sustainable Development Goal 1.2 of “halving multidimensional poverty by 2030”.
The paper also notes rural India has seen a larger decline in multidimensional poverty. Between 2015-16 and 2019-21, poverty in rural India decreased from 32.59 per cent to 19.28 per cent, while urban poverty fell from 8.65 per cent to 5.27 per cent.
However, NITI Aayog’s poverty projections have been questioned on the grounds of a) the choice of indicators, b) methodological approach, which is also referred to as “an index of service delivery”, c) reliance on household survey data, and d) lack of recent poverty data as poverty statistics haven’t been updated since July 2013.
Therefore, the emphasis has been on the need for frequent poverty data to support more effective rural policy development and poverty alleviation programmes.
